In the course of learning how to work with data in the R statistical programming language, I ran into a problem whenever I tried to plot multiple columns in a dataset – like this, for instance where we are looking at local authority level coronavirus vaccination figures obtained from Public Health England:
> head(vaccs_combined)
        date                            areaName First Second
1 2021-05-19 Bournemouth, Christchurch and Poole  2428   1838
2 2021-05-18 Bournemouth, Christchurch and Poole   349   2048
3 2021-05-17 Bournemouth, Christchurch and Poole   293   1050
4 2021-05-16 Bournemouth, Christchurch and Poole   384   1424
5 2021-05-15 Bournemouth, Christchurch and Poole  1632   3987
6 2021-05-14 Bournemouth, Christchurch and Poole   550   2007
This sort of presentation of data is great for humans to read, but rather more difficult for R to understand. The problem is that in the context of this data, the column headers First and Second don’t actually represent a variable in their own right, rather they are values of a hypothetical variable that doesn’t exist yet, describing the type of vaccination event.
What on earth are you talking about?
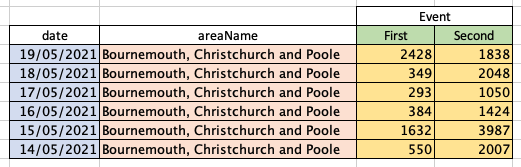
It’s probably easier to explain this visually. Breaking out into Excel so I can easily colour code the cells, our data currently looks like this:
Whereas for R to be able to interpret it and neatly plot the data, it needs to look more like this:
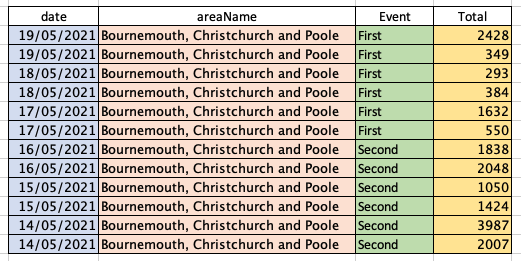
This is the difference between wide data, shown in the upper table, and long data, shown in the lower table. Immediately you can see that the long data is not quite as easy for us humans to interpret – this is why both wide and long data are perfectly valid methods of presentation, but with different use cases.
Column headers containing values instead of variable names is in fact the first common problem of messy datasets described by the New Zealand statistician Hadley Wickham in his paper Tidy Data1Wickham, H. (2014). Tidy Data. Journal of Statistical Software, 59(10), 1 – 23. doi:http://dx.doi.org/10.18637/jss.v059.i10. For interest, the full list of common problems is:
- column headers being values, not variable names;
- multiple variables being stored in one column;
- variables being stored in both rows and columns;
- multiple types of observational units being stored in the same table;
- a single observational unit being stored in multiple tables.
Thankfully, in the covid vaccination data we only have to deal with one of these problems! As is usually the case in R, there’s more than one way to solve our this particular problem.
We tidyr the data and gathr
To elongate our data, we are going to use the gather function that comes as part of the tidyr package. tidyr helps us create tidy data. In his Tidy Data paper, Wickham cites the characteristics of tidy data as being:
- each variable forms a column;
- each observation forms a row;
- each type of observational unit forms a table.
First off, let’s install tidyr:
install.packages("tidyr")
In our R script we will then need to load tidyr so we can use the gather function:
library("tidyr")
Our data already exists in the dataframe vaccs_combined – as a reminder it’s currently set out in a wide format like this:
> head(vaccs_combined)
        date                            areaName First Second
1 2021-05-19 Bournemouth, Christchurch and Poole  2428   1838
2 2021-05-18 Bournemouth, Christchurch and Poole   349   2048
3 2021-05-17 Bournemouth, Christchurch and Poole   293   1050
4 2021-05-16 Bournemouth, Christchurch and Poole   384   1424
5 2021-05-15 Bournemouth, Christchurch and Poole  1632   3987
6 2021-05-14 Bournemouth, Christchurch and Poole   550   2007
We’re going to create a new dataframe called vaccs_long and use gather to write the elongated data into it. gather works like this:
gather(data, key, value, ..., na.rm = FALSE, convert = FALSE)
- data – the dataset you wish to modify (in our case vaccs_combined);
- key – the name of the new variable you wish to create (in our case event);
- value – the name of the new ‘value’ column (in our case total);
- … – the names of the columns you wish to gather together (in our case First and Second);
- na.rm – whether or not missing values should be removed (we won’t do this);
- convert – convert data into another format (we won’t be using this either).
And so the command we run is as follows:
vaccs_long <- gather(vaccs_combined, event, total, First, Second)
Hey presto! Our data has been converted from wide to long:
> head(vaccs_long)
        date                            areaName event total
1 2021-05-19 Bournemouth, Christchurch and Poole First  2428
2 2021-05-18 Bournemouth, Christchurch and Poole First   349
3 2021-05-17 Bournemouth, Christchurch and Poole First   293
4 2021-05-16 Bournemouth, Christchurch and Poole First   384
5 2021-05-15 Bournemouth, Christchurch and Poole First  1632
6 2021-05-14 Bournemouth, Christchurch and Poole First   550
- 1Wickham, H. (2014). Tidy Data. Journal of Statistical Software, 59(10), 1 – 23. doi:http://dx.doi.org/10.18637/jss.v059.i10